Show Graph
The Show Graph option displays CAT-100 data in line graph form. This is derived from the data presented in the grid form displayed on the CAT-100 main screen. An example of a graph is shown in Figure 58.
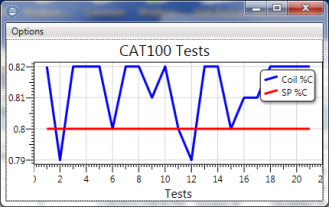
Figure 58 - Example of Line Graph in CAT-100 View